By Dr Grace Kite

The TV playbook for online businesses

A lot of e-commerce businesses have emerged from the pandemic with money to spend and big ambitions, and many have opted for advertising on TV. In 2021, spending was up nearly 40% vs 2019.

But online born businesses aren’t always comfortable with advertising on TV. It’s different to the media channels they grew up with, like search and paid social.

That’s why Thinkbox commissioned magic numbers to do some research on how online businesses can best use TV advertising. Together, we wanted to provide some case studies and some rules of thumb, a playbook.

Below is the presentation, along with what we said to explain the charts, from when we launched the research at an event in London on 16th November 2021.

We started the project by talking to the people in the picture above. 5 of them are senior e-commerce marketers and 2 are media specialists from agencies that work with lots of e-commerce businesses. We asked them about their experience in growing online businesses, the decision to use broad reach media including TV, and what happens when TV airs.

Then, we analysed the experience of 10 businesses that have seen success using TV.

It wasn’t a random sample of brands. We picked businesses that are doing TV and seeing good results so that the research focussed on what TV-done-well looks like.

But even if it wasn’t a random sample, we did include a good variety of brands. The left-hand chart below shows how our 10 brands talk about themselves. Within the 10 there are D2Cs, fintechs, and businesses that are driving the digital disruption of their category. There’s also one business that isn’t selling anything per-se but offers an online service and sells advertising space, and one business that is marketing an app.

The right-hand chart shows the TV spend of each of the 10 brands. They come from a range of different sectors – from gifts, to food, to cars, to dieting. And there is a good range of TV budgets here too. Our biggest spender allocated £28m to TV over 3 years, and our smallest spender only £1m.

This was a substantial scope for an analysis project. We analysed 3 years of recent history for each of the 10 brands – who collectively make up 30 years of experience – and evaluated £106m of spending on TV to model and explain 120 million website visits in total.

The first outcome we looked at is website visits. We analysed it using econometrics, which is the gold standard for evaluating TV. It doesn’t rely on cookies, so it isn’t vulnerable to ad blockers, or Apple’s latest updates, or bots.

Econometrics is also able to include other things going on in the outside world and untangle them from the TV effect, and you can see those things on the slide in the dark pink.

We HAD to include Covid – it changed so much behaviour after March 2020. And there were other things that interviewees said were important. We trawled the press for funding announcements so that we could control for these businesses having more money to spend, and we looked at each brand’s main competitors – including their web visits and news announcements.

We do have to say, though, that we only used data in the public domain and we weren’t able to collaborate with the businesses themselves in this work. That means the data feeds going into the modelling weren’t perfect. We used website visits from Similarweb and offline spends from Addynamix – both of which are estimates rather than actuals.
We had good data on linear TV from BARB, but data on BVOD – that’s advertising on 4od or ITV hub – is harder to get and we couldn’t get it for the full 3-year period. That’s why it’s in grey on this chart.

But in other places, publicly available data is great – for example both Google and Apple are publishing very detailed data on mobility, so we know we’re capturing the effects of the pandemic clearly.

The modelling didn’t just cover how TV affects website visits. We also analysed how people get from seeing a TV ad to the website, and what people click on the way.

And that’s important because if someone clicks on a generic search ad on their way to you, that’s an expensive journey. But if they come direct, or via a brand search ad, that’s either free or relatively cheap. So how TV affects outcomes in the search environment is important.

So, we did all that analysis, and went through everything that was said in the interviews, and we came up with 4 sets of learnings about when and how online born brands successfully use TV.

That starts with the WHEN – there are some points in the life of an online born brand when it’s the right time for TV, we’ll tell you about 3 of them.

Then we’ll cover what happens when you do use TV successfully, first in terms of outcomes on the website, and then what happens to paid search.

And finally, we’re going to give you a plan of action, a 2-step approach to working with TV that works for online born brands.

So first off, when is it time for telly?

And I don’t just mean your favourite programme’s on and you’ve got your cup of tea, or the kids have finally gone to sleep.

There are 3 situations in the life of an e-commerce business when advertising on TV can help to reach business objectives.

The first is when you need to scale fast because a new category has opened up and you need to set yourself up as the number 1 brand in this space.

This might be because there are network effects. You might have a product that works better if lots of other people are using it. A classic example of this is eBay, along with all social media platforms too.

But it may also just be because you want your brand to be synonymous with this new category – we don’t say let’s get a rideshare home, we say ‘let’s get an Uber’ – because Uber scaled fast and first.

Chris Seigal’s example of meal kits from his time at HelloFresh in the US is exactly that. A new way of getting ingredients and recipes, bought online. HelloFresh wanted to grow quicker than their well-funded competitors so that they could own this new category.

This is a situation that has played out in a lot of different categories. In the UK, price comparison sites for insurance may have been one of the first. Another example is bed-in-box mattresses, which allow mattresses to be conveniently delivered to one’s doorstep. And currently, it’s also happening for 2nd hand cars, as illustrated in the chart below.

This is a chart that comes out of modelling. Along the x-axis you have time, the pink line is weekly visits to this brand’s website, and underneath the pink line is a breakdown of what drove those visits. Dark blue is search, yellow is TV, and orange is when TV and search worked together. Grey is other drivers (things like weather, the pandemic, and the economy).

This brand first did some testing and learning with TV, and then scaled up spending. There are some recommendations on the former below. The good news is, it is possible, there are tools available.

In this case, it was when their spend scaled that website visits really took off. They got to 500,000 visits per week in 5 months, with the majority coming from TV (in the yellow) and TV working together with search (in the orange).

It’s also a good time to use TV if your product is clever or particularly difficult to understand.

This can be related to the situation we were just talking about, because it often happens if your business is driving the digital disruption of a category. You’re introducing a new and better, but also unusual and unexpected, way of doing things.

But it doesn’t have to be a digital disruption of a category, maybe your product is better because it has an online community or a better algorithm and somehow you have to explain the benefits of that – quite techy – thing that you do better.

This quote, from Lucas Bergmans at Cazoo – also a 2nd hand cars brand – was part of a bigger explanation he gave us. He said that people would come to their website and ask “Where’s the shop? Where’s the dealership? How can I go and see this car?”

Getting people to buy a 2nd hand car online is new and tricky. There are some people out there that think you’d have to be mad to buy a 2nd hand car online without seeing it. What Lucas said was that it’s not worth doing marketing that brings those people to the website, they are never going to buy from Cazoo, because with Cazoo, seeing the car in real life before buying isn’t an option.

So, in his experience, what TV has been able to do better than other channels, is explain that there is no dealership while also reassure prospective customers that cars are checked, refurbished, delivered with care.

The chart above shows the case of a company that sells a very innovative home gym product that’s also much more expensive than competitors. But it’s a good product and worth the price because of the value of the add-ons that come with it. Exercise classes and an online community. Their product is not just an exercise bike or treadmill.

Our modelling showed that TV drove lots of visits for this brand. And again, it was a very successful launch. They reached 200,000 visits per week at a cost 300 times lower than their hero product’s price.

The chart above adds evidence that, just as Lucas said, TV brings people with the right “level of intent”. That means it brings people to the site who have already understood the proposition and are ready to buy.

One way to measure the “level of intent” is to look at the website conversion rate – that’s the proportion of all visitors that bought something.

And one of our interviewees actually shared her company’s private data on conversion rates. This chart plots that conversion rate on the y-axis against TV impacts per week (i.e., the number of times a TV ad was seen), and the evidence is clear. On average, in weeks when more TV ads were watched, the website conversion rate is higher.

For them, TV brings people who, on average, are more likely to get all the way to the “confirm payment” button.

The 3rd sign that you’re ready for TV is when your normal marketing mix – typically search and social – doesn’t seem to be working anymore.

This situation can show up in dashboards as a loss of efficiency in online channels, or people trying to spend another £50k but seeing that it doesn’t make any difference to sales. The other symptom is simply slower growth.

This is a very typical stage in the life of an online business. So much so that Tom Roach and I made the ramp and bump chart below to describe it.

This chart has time along the x-axis, and sales from advertising plotted against the y-axis.

The left-hand side of the chart is when the business is young, and growth is coming from scaling up online marketing – mainly paid search and social. This is a good way to get growth when you’re a young online business. It’s cheap, easy to control and it can drive growth for a long time, often several years.

This strategy works in the early days because there are always a number of potential customers researching or shopping online who are in the market and not loyal to a competitor. Businesses with a reasonably strong product offer and a well targeted message can convert these people into a sale very cheaply.

But, in the middle of the chart, once the business has reached a certain size, growth stalls, and traditional tactics aren’t working any more. The business has reached the ‘no more efficient buys’ plateau. And you can see on the right-hand side of the chart what the solution is.

You either need to reach people who aren’t in the market right now and stay in their minds until they are, or you need to convince people who currently prefer a competitor. That means wider reach, richer creative, and attention-holding media channels, like TV for example.

When businesses take that next step, you see not only a direct effect, but also a synergy where suddenly there’s increased effectiveness of performance marketing – finally breaking through the plateau.

The chart above is an example of exactly that pattern from our modelling.

This dieting business had a period of growth using online channels only, but then reached a plateau. When they went onto TV they saw a direct effect, but also a better response to search. And growth takes off again.


In this next section, we are going to delve into what happens when you do go on air with a successful TV campaign.

People often talk about the effect of TV being something that happens in the long term, so that you get the benefit “later” or “eventually”. But what we’ve found both from talking to people who have done it, and from our modelling, is that you do actually get an immediate, visible and big effect straight away.

There were lots of stories in our interviewing like this one, above, where it’s exciting. Where people gather around the google analytics dashboard, and watch together the effect of being on TV. And they can straight away see, just lots of people arriving on site.

Here’s another one:

And another:

And it’s clear in the data too.

On the chart below, time is on the x-axis, the pink line is website visits, and the dark blue bars are TV impacts. What we’re seeing here isn’t from modelling, it’s just the data.

You don’t need modelling to see that there is an immediate impact of the TV on website visits. And you can also see clearly that the effect doesn’t die away completely when TV goes off air.

The chart above is an example of an unknown brand launching and then spending a LOT of money – all those dark blue bars add up to £20m.

But it’s not just big spenders or launches where the TV effect is super visible.

The chart below shows the same picture but for a much smaller brand. Already up and running, but not massively well known.

They’re not spending anywhere as much on TV as we saw on the slide before, a total of £3.4m over 3 years. But it’s still really clear that when the TV is on, website visits respond.

And here (below) is the reason why TV brings that immediate response. It’s because people watch TV at the same time as looking at their phones.

This is IPA touchpoints data, and it shows, by time of day what proportion of people are watching telly – that’s the green line – and what proportion are watching telly with phone or internet in hand – the orange line.

And it works out that between 15 and 40% of people who are watching TV are using the internet as well. That means if you’re an e-commerce brand, people seeing your TV ad often have the means to respond right there, right now – under their thumbs.

So, now to the numbers that came out of the modelling.

The chart below shows how much that immediate impact contributed to website visits in our 10 brands.

The chart shows that TV was the biggest single driver of traffic. It contributed 42% of all visits which is around 50m visits.

And that matches with what we heard in the interviews. They said that for their businesses, a very high proportion of sales are being driven by marketing, and our modelling found the same thing.

Between them, the 10 brands had 120m visits to their websites, with 80% driven by marketing communications, and 67% from TV and search.

TV visits were also good value for money when compared to the other offline channels that our 10 brands used.

What you see in the chart above is the value for money calculation. On the left is spending by channel, in the middle, the visits that spend brought in, and then on the right spend divided by visits to reveal cost per visit. A lower cost per visit means better value for money.

Unfortunately we weren’t able to include online channels like search and social on this chart because there’s no publicly available data on spending. Equally, other offline channels like press and cinema aren’t here because our 10 brands hardly use them.

But what’s clear is that – as compared to posters and radio – TV is better value for money, averaging at £2.10 per visit.

The chart above plots that value for money metric – cost per visit – for each of the 10 brands separately. And what’s really clear on it is that the majority, 6 of the individual brands, had a cost per visit at around £2.

Of course, there are some exceptions. At the top are some brands with a higher TV cost where it’s a big ticket-value product, either a complex financial product, or that expensive gym equipment we talked about earlier.

And then at the bottom, one D2C brand with a simple proposition who have undertaken serious optimisation of their TV plan over the years to target cheap visits.

But look, we think that £2 is a good benchmark for most e-commerce businesses to plan around, and it compares favourably to other channels that many marketers in this space will be used to. For example, when we checked into Google ads, generic search cost per visit in gift delivery were between £1 and £3, and in financial services, between £5 and £11.

But what’s also important about TV – and it goes back to the point we had earlier about the ramp and bump chart, and breaking through the ‘no more efficient buys plateau’ – is that TV can reach outside the pool of easily available shoppers online.

This chart has cost per visit on the x-axis, and you ideally want that to be low. It has the number of website visits generated, or the scale of the effect on the y-axis, and you ideally want that to be high.

So channels that balance scale and value for money are going to appear in the top left of this chart. And look it’s clear that in our 10 brands, TV is better able to offer both things than either of the other 2 offline channels our brands used.

What else? Well, we called this section “instant gratification and then some”.

That’s because as well as the immediate effect of TV which we started this section with, TV does have a long-lasting effect. The chart below shows WHEN you see the website visits driven by different media channels in terms of the number of weeks after airing. The number of weeks it takes to see the first 50% is plotted in bright colours, and the number of weeks it takes to see the 2nd 50% in a lighter shade.

It’s clear, outdoor and brand TV – that’s TV using rich creative usually airing in peak slots – have a long-lasting effect, they are capable of brand building. Both continue to drive visits until 2 years after airing.

And this is in sharp contrast to search and social, which have all of their effects straight away, and don’t last.

In the interviewing, people mentioned lots of different benefits of brand building. Many of them have been covered in lots of detail elsewhere – by the likes of Les Binet and Peter Field, so I’m not going to go over them here.

Instead, I’m going to mention two benefits of brand-building which are specific to relatively young online born brands.

And this one is key. It’s that brand building insulates this type of business from a vulnerability that many of the e-commerce marketers talked about.

This quote from Cheryl Calverley of Eve Sleep makes it super clear. The thing is, these new businesses only exist online. No-one is walking past the shop. No-one’s friend, or family member is recommending. No-one is buying this brand out of habit.

And what that means is that if you don’t keep spending on marketing, there’s nothing to fall back on. If something goes wrong in the tech or the finances, and for some reason performance marketing has to stop, what then?

Brands – once built – are a source of stability, of certainty, of something that will endure

And here’s another reason – this time it’s one that will go to the heart of the issue for many e-commerce businesses. It’s that brand building is important because the brand is something you can sell.

A lot of the time, when you sell a scale up business, it’s not profitable, so you aren’t selling the future flow of income. And often the infrastructure and website could be copied by someone else overnight. So, what you are selling is the brand.

This point is most obvious for D2Cs. For example, Tails.com, who sell pet food direct, was recently bought by Nestle. When you think about it, as Tom clearly has – what is it they were buying? It was the brand.

In this next section, we’re going to delve into the findings on how TV and search work together.

What we’ll see is that TV isn’t “instead of” performance marketing. TV actually makes the search marketing team’s job both easier and more effective. The two things work well together.

The first, and we think most important, finding is that the vast majority of TV visits don’t incur huge additional costs in the search environment.

Across our 10 brands, 86% of journeys initiated by TV either came via a click on organic search, or someone directly typing in the advertiser’s domain name, or – in about a fifth of cases – someone clicking on a brand paid search ad.

That’s important because direct and organic visits are free – they don’t incur any costs in the search environment. And brand paid search ads are much cheaper than generic ones, its much less costly per click to advertise your own brand name than to put your brand at the top of the google page when someone searches for a category term.

With TV, only 14% are that expensive type of journey, where a person clicks on a search ad that targets a generic category keyword like “diet” or “car insurance”.

What’s going on – we think – is that TV is actually very successful at lodging the advertiser’s name and domain in the minds of people who see the ads. That means that the online journey involves the brand name early.

The chart above shows how that finding for TV compares to outdoor and radio – the other 2 offline channels that our 10 brands used a lot. We saw on the previous slide that TV only needed an assist from generic paid search 14% of the time, but for outdoor and radio that number is much higher.

Almost a quarter of all journeys initiated by someone seeing a poster or hearing something on the radio needed an assist from an expensive generic search ad. That’s a quarter of people who searched the category rather than the brand and clicked on a paid ad.

And it figures, if you’re watching TV with your phone in hand you’ll make that online journey straight away. You won’t need to mess about searching for something that describes the category to rediscover the name of the brand in that ad.

With outdoor and radio, it’s different. You might be out and about. Or in your car. That means the online journey isn’t going to be immediate, it’s going to be later the same day at best. And likely – by then – some people will have forgotten the brand name and instead, they’ll search the category. The advertiser will have to pay for that generic click.

What we’ve also discovered during the interviews and in research around the main modelling is that TV makes search ads more clickable. The left-hand side chart above is from an IPA awards entry by Direct Line Group, an insurance company. It shows that the click through rate for organic search ads is higher when TV has been on.

On the x-axis this chart has organic search ranking, and the bars are click through rate of search ads. The green brand – Privilege – hadn’t done TV, whilst the pink brand – Churchill – had. And what we see is that, regardless of the rank, the click through rate is higher for the brand that was using TV.

The right-hand chart shows a similar result, but for paid search ads. On the x-axis we have brand reputation score and the bars are for click through rate. And you can see that as the brand’s reputation grows, perhaps because the business has been on TV or done something else to build its brand, so does the click through rate.

There is a slight dip that breaks that pattern at the top-score on reputation. We think that’s because when the brand reaches that level, most people come to it direct.

Now, this study was on an e-commerce platform, but in our work with our clients, we’ve seen the same thing in Google environment too. TV makes your search ads more clickable.

Higher click through rates on search ads are important in two ways. There’s the obvious effect – which is that more people are responding and then coming to your site. But click through rate is also something that the Google algorithms see and respond to.

This flowchart visualises the role that click through rates play. Starting on the right-hand side, TV leads to an improved click through rate on both organic and paid search. The search algorithms see this as an improvement in the quality of the ads and act accordingly.

That means for organic your ad moves up the page – which can act as a multiplier to everything you’re doing because people just see you without having to scroll so far.

And a higher click through rate for paid search means that the algorithm will assign you a higher quality score, which makes it more likely you’ll win the auction, and can sometimes allow you to win an auction at a lower bid price. In other words, it means your paid search ads get cheaper.

So, this is really an important effect of TV in the search environment.

And look, click through rate is also just a really good metric that you can monitor when you go on air with TV, because it’s absolutely an indicator of your brand and presence getting stronger.

And these effects that improve your status in the search environment are important, especially if you are a relatively young, or small-ish brand. It’s because the paid search environment isn’t a level playing field, it’s hard to be small.

The slide above is all about brand paid search.

And, as Cheryl says, when you’re small or less well known, there are some hard challenges to overcome, even when someone searches for your brand. What happens is that even when people search for your brand name, they may well end up clicking the paid listing for a bigger competitor.

And there’s two implications of this in branded search. The first is that if you are a smaller business you have to buy paid search ads to ensure that you come up ahead of that big competitor. To make it harder for the competitor to capture your sale.

But – and this is doubly unfair – because the bigger competitor gets a good click through on YOUR BRAND NAME, they can actually buy it cheaply, sometimes even more cheaply than you can.

They’ve got an advantage even when they weren’t the customer’s first choice. So, it’s really not a level playing field.

And the playing field is also tilted in favour of bigger businesses in generic search. In fact, this is an even harder situation if you are small and have a bigger competitor.

It’s partly because the bigger competitor will likely have a bigger budget to play with, and then on top of it, the way that the algorithms work is going to make their costs in generic search cheaper. It’s because the bigger competitor gets a better click through on the terms that define your category “flower delivery” or “pet insurance” or “exercise bike” or “mortgage”.

So, they get a higher quality score, and that means it’s easier for them to win the auction, even if they bid a lower cost per click, and you get the situation described in the quote there from our interviewing. If you’re the small brand, you just can’t keep up.

What all this means, especially when taken together with what we said on the previous slide, is that the way search works makes it important to be big. Or to put it more exactly – the way search works makes it important to be bigger than your main competitors.

And that means that arguably every e-commerce business needs to scale fast and first.

As we’ve covered in the first section, TV is a really useful option if you want to scale fast and first. But it’s also a really useful tool to tackle click through rates and so the quality rating that the algorithms give you.

We already saw two case studies where click through rate was improved when the business went on TV or had otherwise improved its brand reputation – from the Direct Line IPA paper, and the academic study on an e-commerce platform.

This slide is a 3rd example. It’s a history contributed by one of our interviewees, where for a period of time TV spend increased a lot. Here, TV views averaged out to c.10m views on a TV ad per week in the first era, then scaled up in the 2nd phase, and in the 3rd era maintained mostly around 30-40m impacts per week (some weeks going as far as +70m!).

And it’s clear in this case that click through rates on brand paid search increased. We’ve examined the data coming out of the dashboards in each of these eras, and its visibly increasing. The performance marketing team involved have seen it, that increased click through rate, that better quality score, and their paid search advertising costs per sale coming down.

So, what should you do if you are an e-commerce business and you want to start using TV?

Well, the good news is that there is a clear answer to that question. Yes it depends on what sort of business you are and your circumstances, but there are two steps that generally make sense.

And I need to say a really big thank you to Simon Wilden from Goodstuff and Tom Beardmore formerly of Goodstuff and now at Chamber for much of the guidance in this section.

Two gentlemen who have had a lot of experience doing really good media planning work across a lot of e-commerce scale up brands, and because of that were able to draw patterns about what works more generally.

The first thing to say is that it is absolutely possible to do test and learn with TV. And for many online born businesses that is the right first step because it is a way of working that marketing teams are already familiar with.

Start with a type of TV that allows you to make decisions in a way that’s close-ish to the way you choose what online media to buy. That’s DRTV, a type of TV where – as Simon puts it – “there’s a level of control between inputs and outputs, and there’s data capture”. This is the type of TV that gives you an attribution report and allows you, over time, to optimise.

But what is DRTV? Well, it stands for direct response TV, and, in the olden days when people would respond to TV ads by calling the call centre, it always used to mean ads that aired in the daytime, that had a strong call to action asking people to actually phone in.

Nowadays it doesn’t have to be daytime, but it is always in cheaper TV slots. That can be daytime but it can also be late night, weekend, or early evening on smaller channels or weaker shows.

These are times when people may be less engaged with the programme they are watching and more likely to have phone in hand ready to respond. And because the spots are cheaper, and people generally invest a minimal amount into the creative work itself, this is the type of TV that has the lowest monthly outlay.

For many businesses, the returns from that outlay can easily be improved with measurement. Because DRTV always targets an immediate response, it’s possible to match back the number of web visits you get in the minutes after the spot aired – a process called spot matching.

When used to improve the choice of spots, this can improve the return on investment a lot in the first few months of TV activity.

In our models of the 10 brands, we were able to separate the effect of DRTV from other TV for 3 of our advertisers.

And to do that – remember that we didn’t have access to the advertiser’s own plans – we’ve said daytime or late-night slots are DRTV while spots that aired in the early evening, which is peak TV viewing time, are likely not DRTV.

So, this is not conclusive by any means, but what we saw was that in 2 of these cases, DRTV returned considerably more visits per TVR.

But DRTV is only one of the options available to use on TV, and actually there are lots of occasions when it’s possible to get better return on investment by using TV with richer creative and in more expensive slots.

But doing this well does mean using a different type of decision process. A move away from test and learn into professional media planning, and a move away from the kind of content that works online to higher quality and more expensive films, made by an advertising agency.

There are already a number of very good agencies that are specialised in working with online born brands, they’ve done this before and can offer the right advice. And they can negotiate good deals on TV spots because they are always buying space from the big TV media owners and have the right relationships.

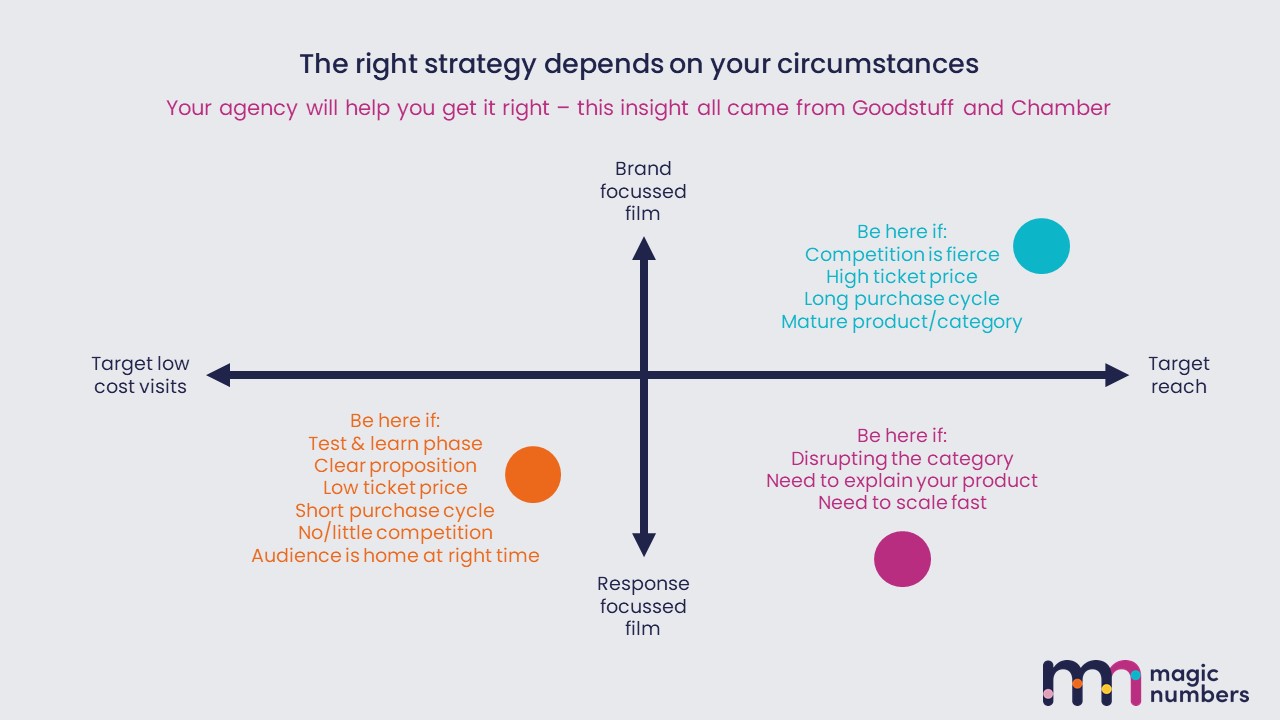
Agencies are also really good at knowing what the right thing to do is for your specific circumstances

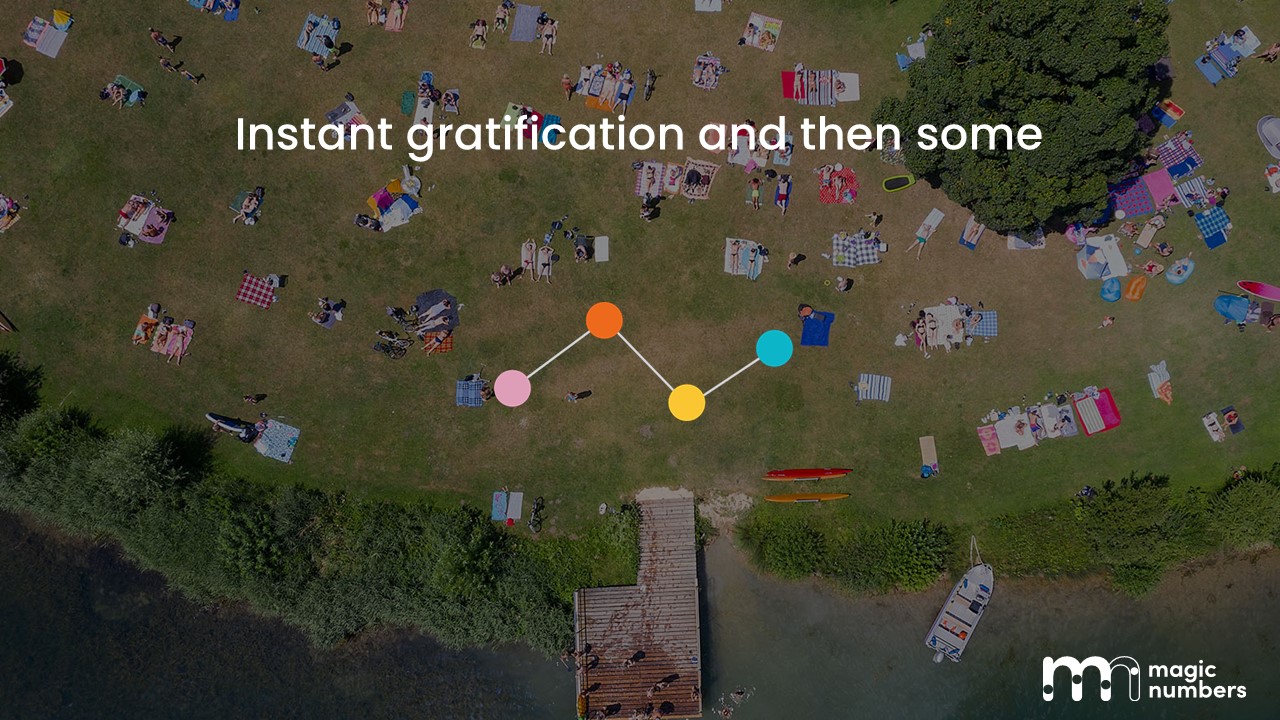
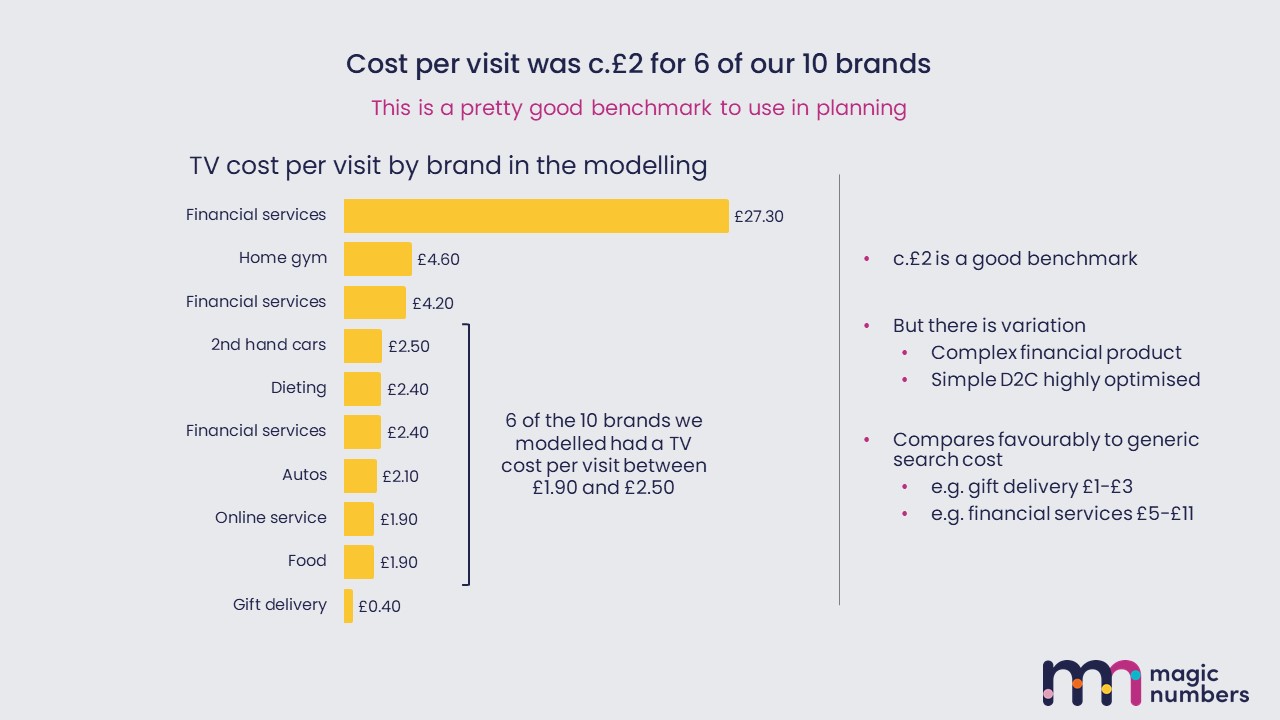
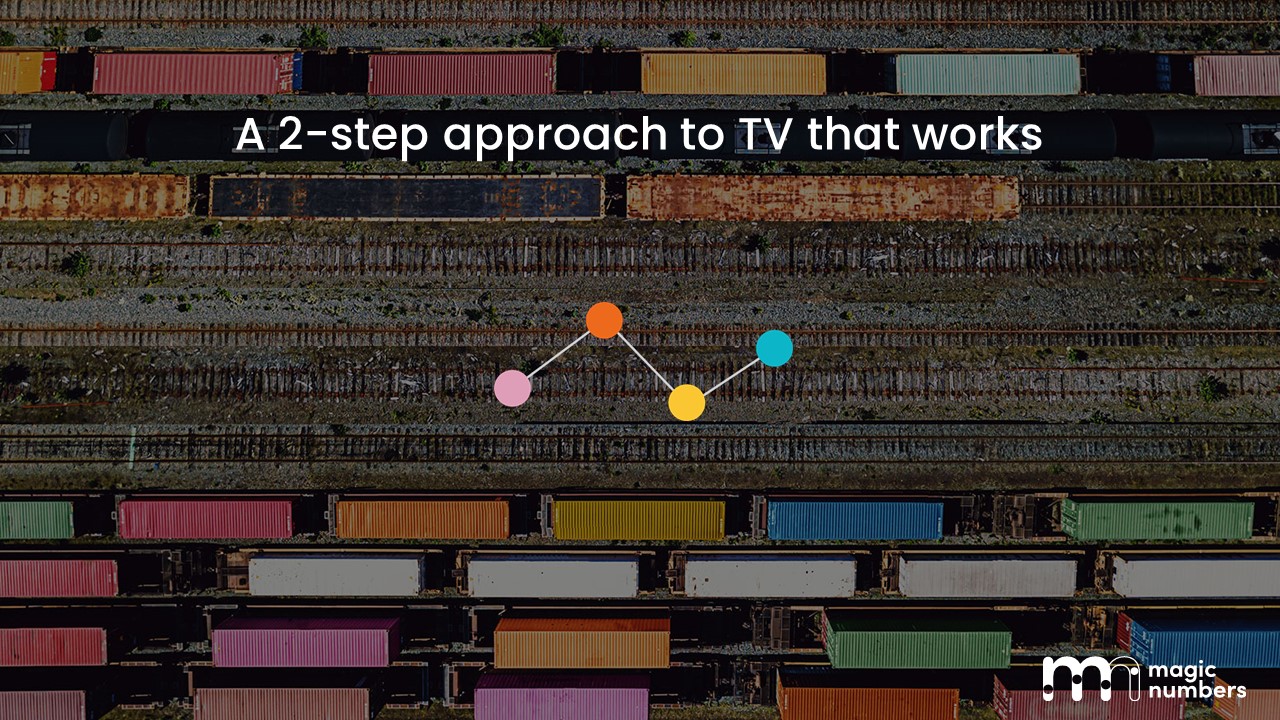
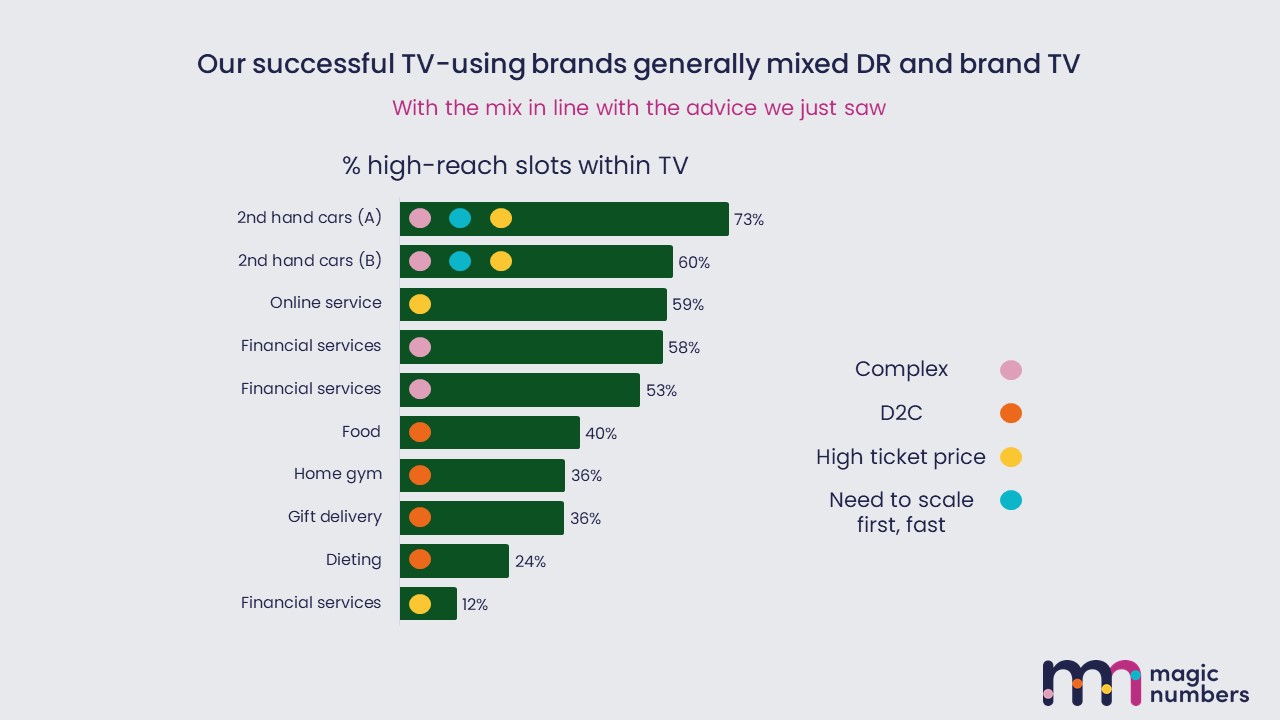
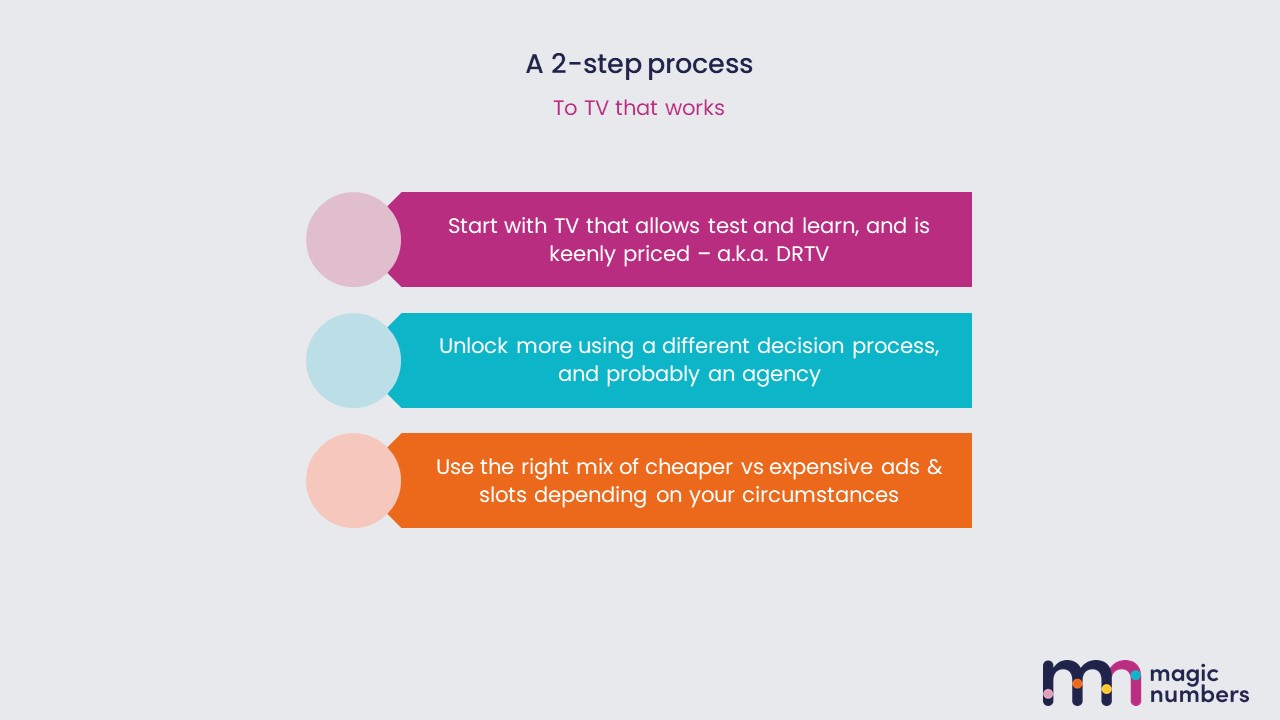
So, you may start in the bottom left on this chart, targeting low-cost visits with a response focussed film. And actually, you may well never need to move from that quadrant if your circumstances are right for DRTV. That is when the sell is not particularly hard…. you’ve got a product that’s easy to understand and not too expensive, the competition isn’t too fierce, and the target audience is watching telly when cheap slots are available.

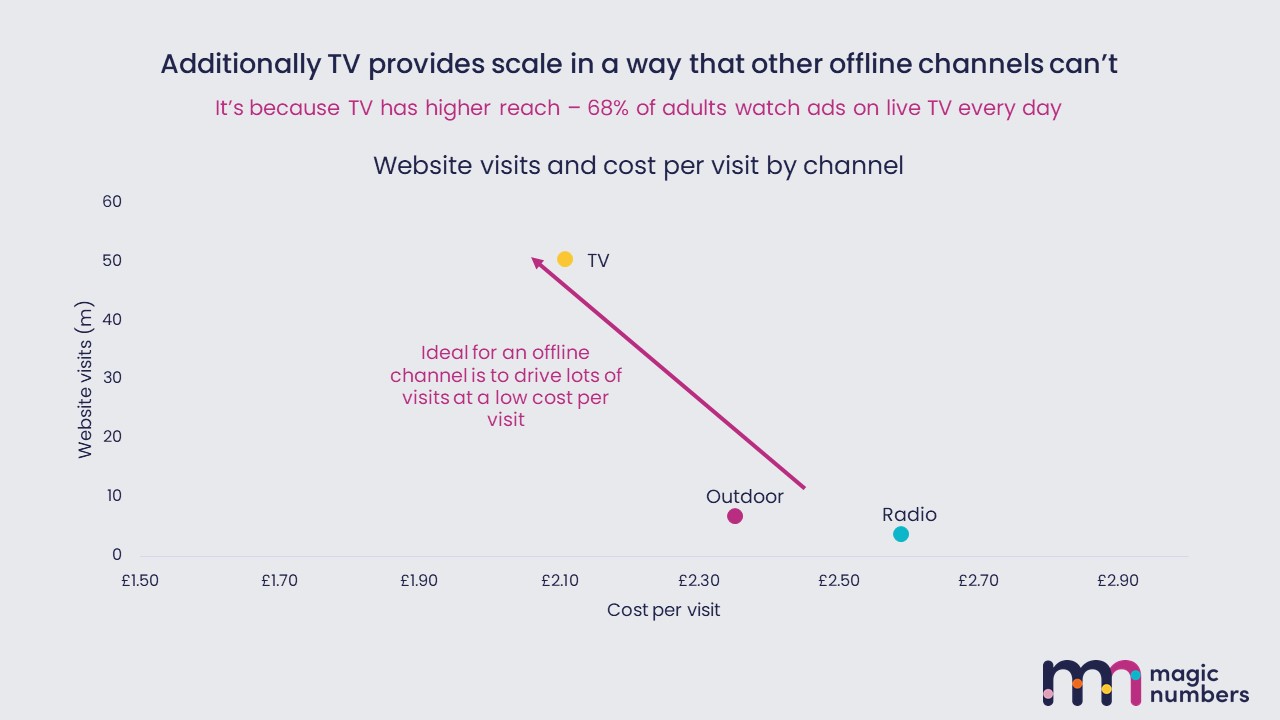
But in some circumstances, where the sell is a bit harder, you may need to move out of that quadrant. If so, you’ll pay a bit more per visit, but reach more people and get a larger scale response, and you may invest in a richer creative that is capable of much more persuasion too.

If you go for both, you’re going to be moving towards the blue corner on this chart – this is where a lot of the Christmas ads that are starting to come out at the moment are. They know that competition is fierce, they know shoppers’ Christmas gift shop is a big outlay, and something that really matters to them. Reaching as many people as possible and bringing out the big guns to persuade them to your brand is critical.

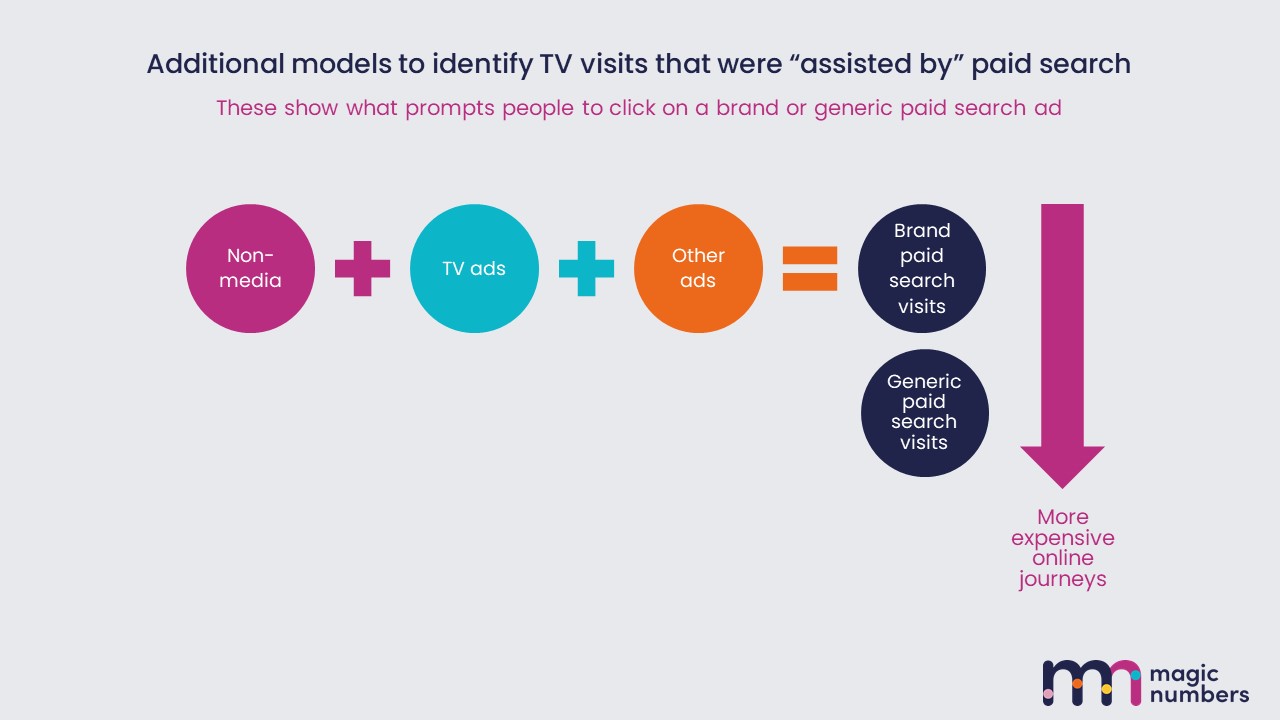
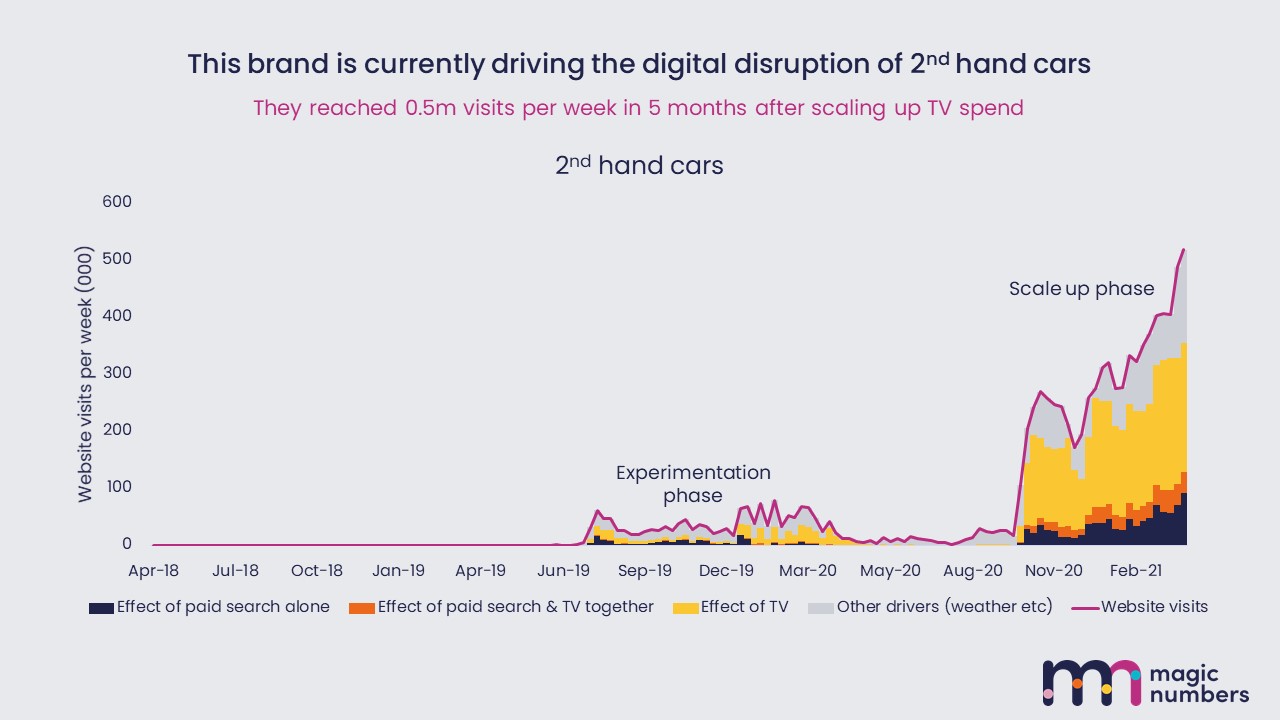
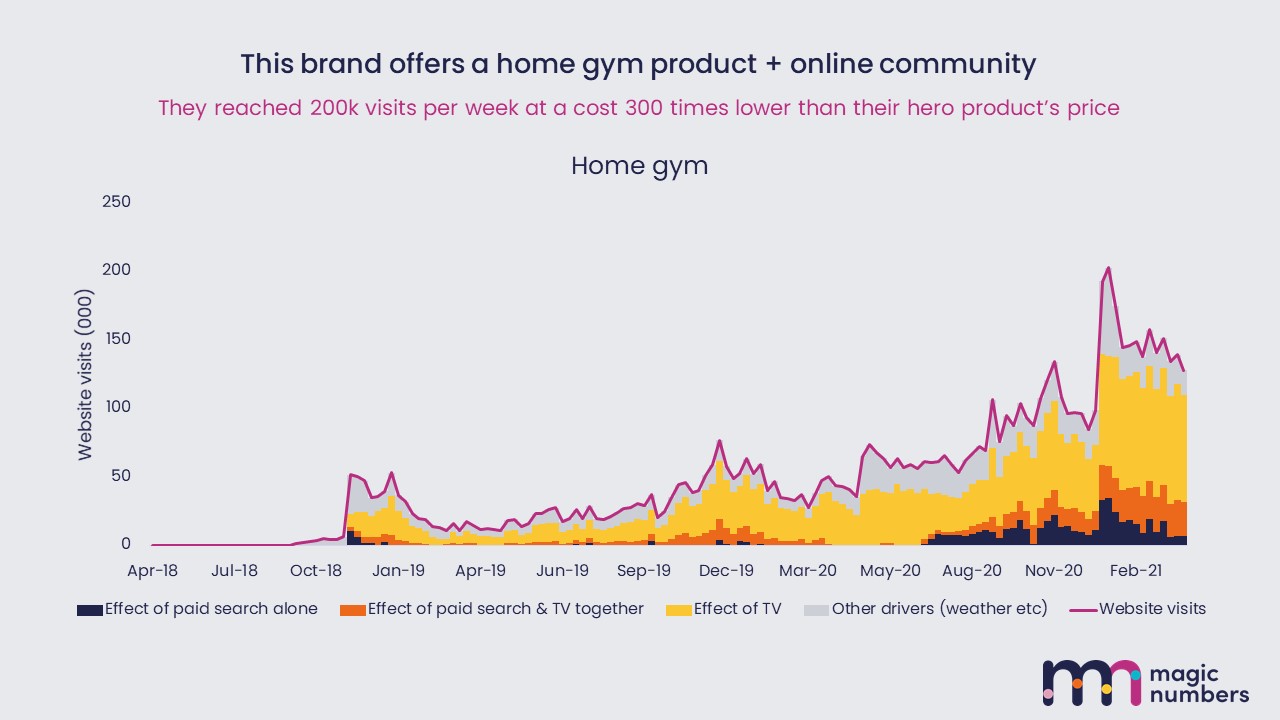
The pink corner is one that’s not typically talked about so much. But this is an important option for many online brands and particularly those that are disrupting their category, doing something very different, or need to scale fast.

This is where you try to reach as many people as possible, but the ad itself doesn’t have to be that persuasive – the new way of doing things is better, right? The job for the ad is to introduce that new way and explain it.

The 10 brands that we looked at in the modelling generally followed the advice we’ve just given. They chose a mix that was appropriate for their category and situation, and that’s important, because remember, these are brands that have been successful in their use of TV.

This chart shows – in the green – the % of each brand’s TV which aired in slots that a lot of people watch, that’s the proportion of their TV mix that is aimed at reach. The blobs identify qualitative aspects of each brand’s situation.

What you can see is that the brands that have a complex product, need to scale first and fast, or had a high ticket-price – tended to go for a mix that had a lot of high-reach slots.

Those that had a simpler proposition, a clear thing they are selling that can just be sent straight away, tended to stick more with the cheaper DRTV slots.

So, here it is, in summary, the playbook for any e-commerce business that is considering first steps into TV.

Start using TV advertising if you see any of the 3 signs:
• Need to scale first and fast – you & competitors are driving digital disruption of the category
• You have a clever new product – you need to educate and drive visits at the same time
• You’ve run out of efficient performance marketing buys and need to look elsewhere

Start with our 2-step process:
• Start with TV that allows test and learn, and is keenly priced – a.k.a. DRTV
• Unlock more using a different decision process, and probably an agency
• Use the right mix of cheaper vs expensive ads & slots depending on your circumstances

And, if it’s going well, you should expect to see:
• An immediate response visible in your dashboards – because people watch TV with phone in hand
• A big effect at a lower cost per visit than other offline channels expect c.£2.00
• A layer of base sales to rely on if you ever need to switch off + a brand that’s a saleable asset

As well as expect better outcomes in the search environment:
• Cheaper journeys because TV prompts people to look for your brand not the category
• Search ads that are more clickable in organic and paid
• Easier and cheaper search buys – levelling the playing field


© 2024 Website &AGENCY